DISCLAIMER: The information and views set out in this article are those of the author(s); and do not necessarily reflect the views of the Centre for Policy Studies or the Indian Institute of Technology Bombay.
Covid-19 made an early appearance in Kerala. The state government was quick to contain these cases and was acknowledged for its efforts. However, this satisfaction was short-lived, as the number of cases started to spike from about 21st March (see here for a visualisation). In fact, Kerala and Maharashtra occupied the top two positions in terms of number of cases between 21 March and 2 April. Kerala went down to third position only on 3 April, when Tamil Nadu overtook it in terms of the number of cases. Since then Kerala has steadily moved to 4th (5 April), 5th (7 April), and 8th (9 April) position, and has since remained there.
Have other states just overtaken Kerala, or has the state been successful in stemming the tide of Covid-19 cases? We present three tell-tale signs to argue that Kerala appears to have successfully turned the tide. The analysis is based on data from the Ministry of Health and Family Welfare, from 10 March to 11 April, in terms of the number of new cases recorded every day, as well as cumulatively.
To begin with, it is worth examining whether new cases (as a fraction of the total cases) have been on the rise or have slowed down. We examine the ratio of the new cases of the past 7 days as a percentage of the total cumulative cases. The reason for taking cases from the last 7 days is to dampen the fluctuation in the number of cases on a day to day basis.
Table 1

The graph above shows an unmistakable trend that the new cases as a fraction of the total cases have steadily come down, and the turnaround has begun from 29 March.
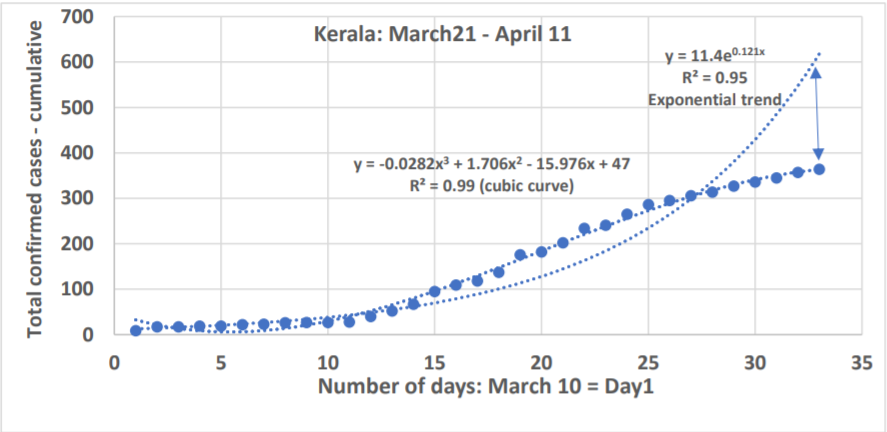
We also noticed that Kerala is bucking the trend of exponential growth seen at the all India level and in most other states (with the exception of Punjab, but the trend is still somewhat fragile).
y = AeKx
(y is the number of cases, x the number of days and K is a constant). The lower the value of K, the better. For India, the exponential growth is given by the equation
y = 39.3e0.1656x with a value of R2 = 0.99.
While for Kerala the equation is
y = 11.4e0.121x with a value of R2 = 0.95 (as of 11 April).
However, when we examine the exponential equation on an ongoing basis, the value of K has shown a clear turn around starting from 29-31 March with a steady reduction thereafter.
Table 2

An equally interesting corroboration of these two trends is provided by the best fit for Kerala through a cubic equation. The negative coefficient of the x^3 term means that cases will go down as x increases.
y = -0.0282x3 + 1.706x2 – 15.976x + 47 with a R2 = 0.99
Table 3
One can clearly see the move away from exponential trend from 27 March, if not before, and this is not a flash in the pan. The table below provides the cubic equations for every day, beginning from March 21.
Table 4

Initially the coefficients of x and x3 are positive. One can gradually notice the unmistakable reversal of the sign of the coefficient of x (becoming negative), followed by the coefficient for x3. More importantly, the value of the coefficient of x3 is steadily decreasing, which means that the number of cases will continue to taper as days go by i.e. x increases.
There are thus clear signs that Kerala has turned the tide and the trend has been consistent. Barring an episodic spike, one can expect Kerala to continue the trend. Only time will tell.
Image: rawpixel.com